Who will own all your data one day? The M&A buyers map
Source: http://www.lumapartners.com/the-strategic-buyer-lumascape/
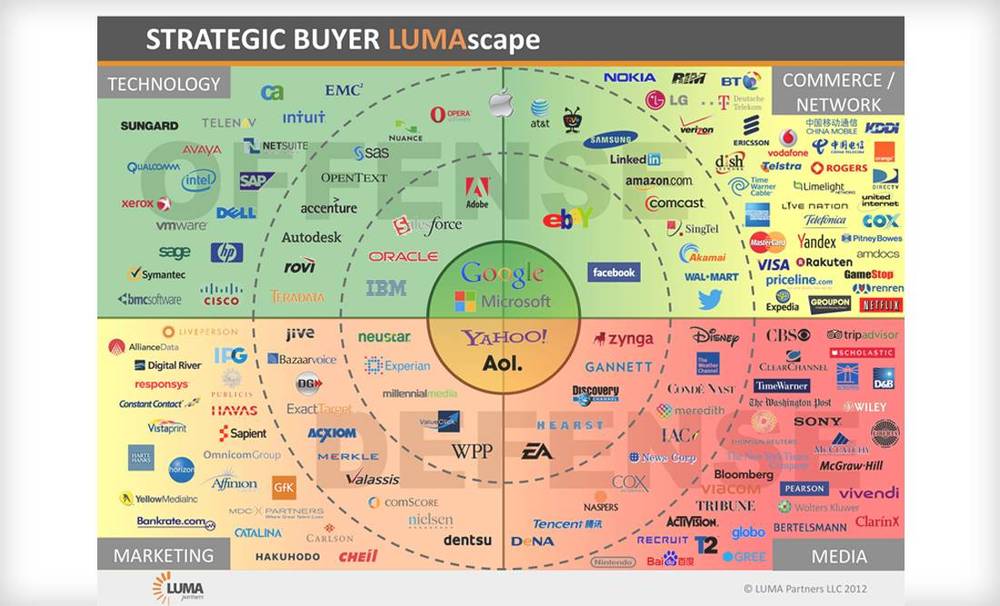
Understanding the chart
It groups the buyers into four quadrants: media, marketing, technology, and commerce/network–companies that “derive large network effects from the delivery of media, communications or commerce,” Mr. Kawaja said. Buyers on the left side are generally firms that sell services to businesses, called “enterprise,” which those on the right are generally provide services to consumers.
Companies closest to the center have a higher propensity for making acquisitions.
The colors represent a sliding scale of the companies’ ability to make “sizable” acquisitions based on their cash available and stock trading multiples, though there are some exceptions. The scale ranges from green (more capable) to red (less capable), with yellow companies falling somewhere in between.
Mr. Kawaja said that just those companies within the circles are sitting on $449 billion in cash or “near-cash,” meaning securities. That said, 87% of that amount is held by companies in the top half of the page–most notably, Apple, which has about $117 billion, and Google, with $43 billion.
Lastly, the chart also tries to split the companies into two groups: those that generally make “defensive” acquisitions because their businesses have been “disrupted,” Mr. Kawaja said, adding that media and marketing companies often fit into that group; and those who make “offensive” moves, such as jumping into a new business or adding talent.