Posts

Showing posts with the label viewpoint

The Gap between #Purpose and #How is filled with #Paradox

Image
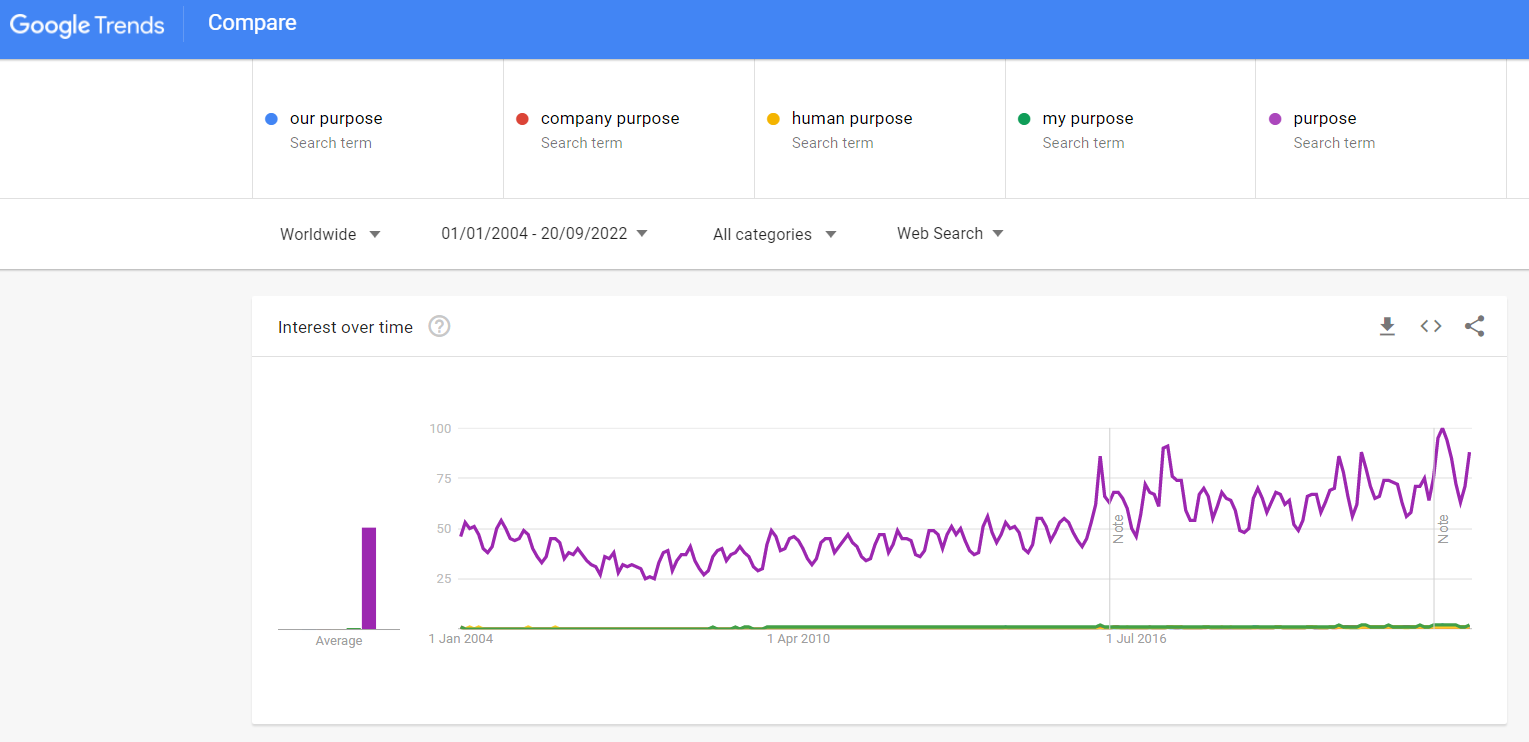
Data would indicate that our global interest in purpose is growing. In truth, searching on Google for purpose is probably not the best place to start, and I write a lot about how to use data to frame an argument as this viewpoint highlights that the gap between purpose and how is filled with paradox. Source: Google Trends The Peak Paradox framework can be viewed from many different perspectives.  In this 3-minute read, I want to focus on the gap between “Purpose” And “How.” For example, Robin Hood's (as in the legendary heroic outlaw originally depicted in English folklore and subsequently featured in literature and film - not the stock trading company) purpose was “The redistribution of wealth.”   He and his band of merry fellows implemented the purpose by any means, mainly robbing the rich and giving to the poor (how they did it).   The Purpose was not wrong, but How was an interesting take on roles in society.   Google’s Purpose is to “ Organise the world's information .”

How we value time frames our outcomes and incentives.

Image
I am aware that a human limitation is our understanding of time.  Time itself is something that humans have created to help us comprehend the rules that govern us.  Whilst society is exceptionally good at managing short-time frames (next minute, hour, day and week),  it is well established that humans are very bad at comprehending longer time frames (decades, centuries and millenniums).  Humans are proficient at overestimating what we can do in the next year and wildly under-estimate what we can achieve in 10 years.  (Gates Law) Therefore, I know there is a problem when we consider how we should value the next 50,000 years.  However, we are left with fewer short-terms options each year and are left to consider longer and bigger - the very thing we are less capable of.  Why 50,000 years The orange circle below represents the 6.75 trillion people (UN figure) who will be born in the next 50,000 years.  The small grey circle represents the 100 billion dead who have already lived on earth

A problem of definitions in ecomimcs that create conflicts

A problem of definitions As we are all reminded of inflation and its various manifestations, perhaps we also need to rethink some of them.  The reason is that in economics, inflation is all about a linear scale. Sustainable development does not really map very well to this scale. In eco-systems, it is about balance.  Because of the way we define growth - we aim for inflation and need to control it.  However, this scale thinking then frames how we would perceive sustainability as the framing sets these boundaries.   What happens if we change it round? What we have today in terms of the definition that creates conflicts and therefore has to ask, is this useful for a sustainable future as we are trying to fit a square peg in a round hole. Economics Definition Perceptions from the Sustainability community and long term impact Hyperinflation Hyperinflation is a period of fast-rising inflation;  an Increase in prices drives for more efficiency to control pricing. Use of scale to create damp

How do you recognise when your north star has become a black hole?

Image
This post is about being lost — without realising it. source: https://earthsky.org/space/x9-47-tucanae-closest-star-to-black-hole/ I have my NorthStar, and I am heading for it, but somehow the gravitational pull of a black hole we did not know existed got me without realising it! I am writing about becoming lost on a journey as I emerge from working from home, travel restrictions, lockdowns and masks; to find nothing has changed, but everything has changed. The hope of a shake or wake up call from something so dramatic as a global pandemic is immediately lost as we re-focus on how to pay for the next meal, drink, ticket, bill, rent, mortgage, school fee or luxury item. Have you become so wedded to an economic model that we cannot see that we will not get to our imagined NorthStar? I feel right now that I have gone into a culdesac and cannot find the exit. The road I was following had a shortcut, but my journey planner had a shortcut that assumed I was walking and could hop over the ga

The laws of 1% - how far before you reach a revolution?

Image
What happens when we decrease life support by 1% Taking water down by 1% per day once you pass a threshold of low water intake and death is a certainty in the short term (blue line). Taking food down by 1% per day, once you pass a threshold, death is a certainty, but it is slower to take you from life than reducing water (green line). Taking lifestyle or experience down by 1% per day gets more challenging and more complex, and you will likely die earlier, but death is not facing you (black line). We all die, but lack of water means it happens now, lack of food means it happens soon, lack of lifestyle means life could have been longer (black line). Leaving purple as the optimal. When reducing water by 1%, you reach a point very quickly where revolution is worth it as there is nothing to lose. When reducing food by 1%, you reach a point slowly where revolution is worth it as there is less to lose. Still, if you go too far beyond the point when you have agency and capacity from suffi

The Paradox that war and monopoly are the same thing.

Image
Peak Paradox is a framework to help you reclaim clarity and control as we believe that if you cannot see the paradox, you have been framed and are in a model where someone else is in control.  When you can see the paradox in the data, information, recommendation or decision, you will have improved your clarity.  This is a guide on how to apply the framework to unlock business models, concepts and complexity . Most aspects of everyday business and life can be questioned within the boundaries of the Peak Paradox Framework.  I have been exploring that we tend to go out of bounds for a while but find it is too hard to stay there for long. Movement outside of the boundary tends to be a transitional state.  The thick red line illustrates the usual boundaries in the figure below.  This post explored how to make better decisions using the framework and laid down the idea that some decisions can occur off-piste, outside of the normal boundaries. It presented the reason why we need to minimis