How and why does exponential stop, break or fail?
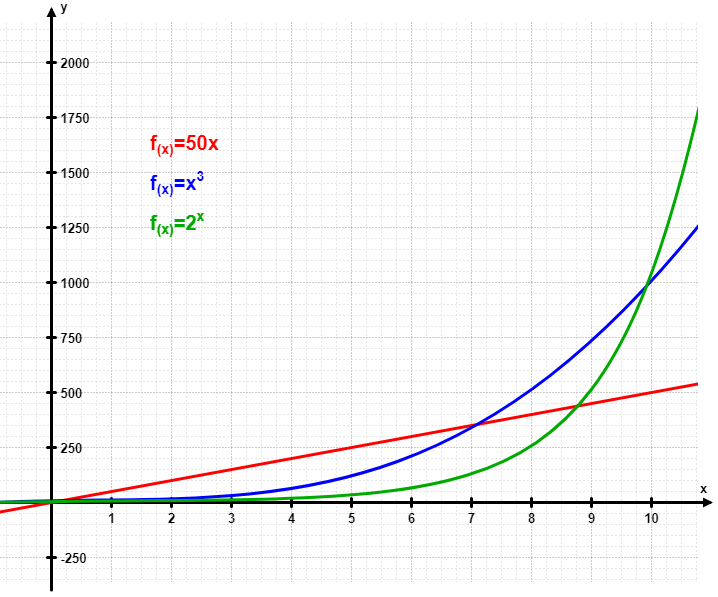
There is a really simple part to this that we know or can imagine. Below is what exponential looks like as a single graph - Wikipedia gives us some fabulous coverage
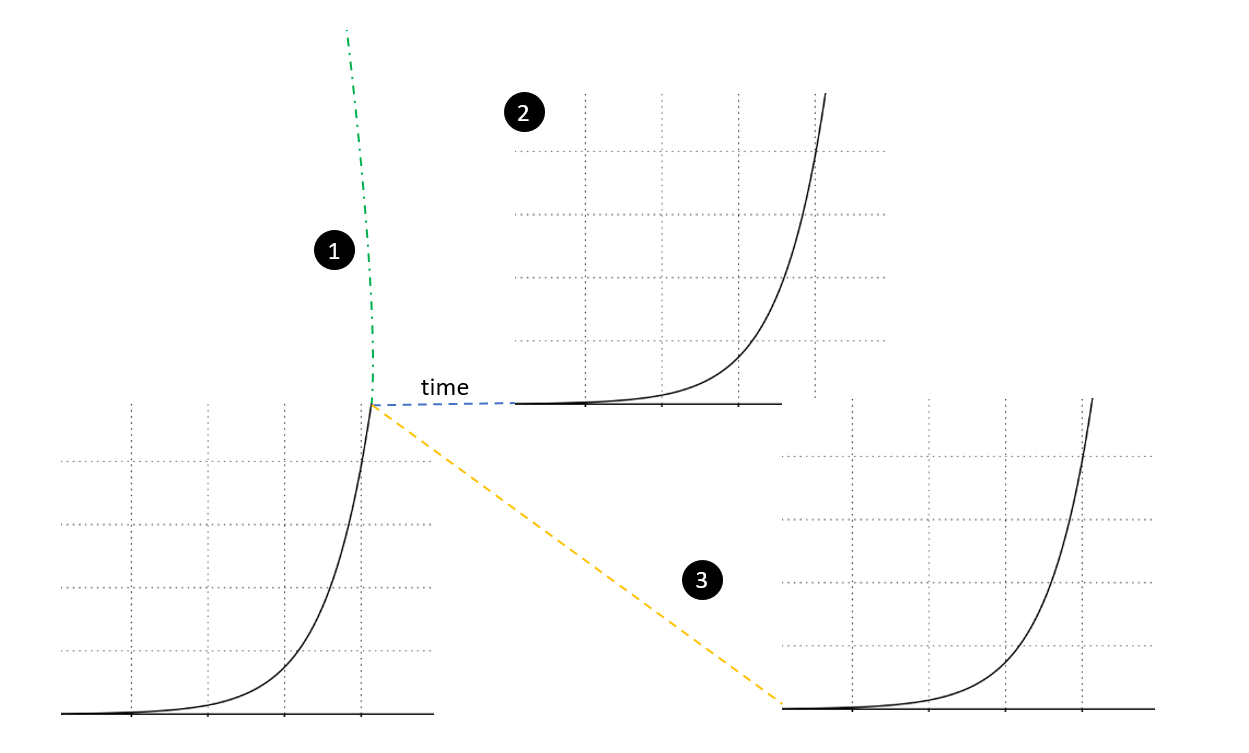
However, what happened before the exponential curve and what happens at the end of the curve. What conditions led to the curve starting and what conditions mean the curve changes at some point in the future.
Both before and after having three possible options
It is just a small part of a much larger curve and the more you step back from the right now data and have more data over time you are able to see that this is just one massive curve that is a continuum (green)
The previous curve reaches a plateau and a period of time enables the readying of the next curve. (blue)
The reduction in entropy (more order) that is a direct result of any curve has to be fully dispersed (return to chaos) in full or in part before another curve can start (yellow), so the same/ similar resources can be used