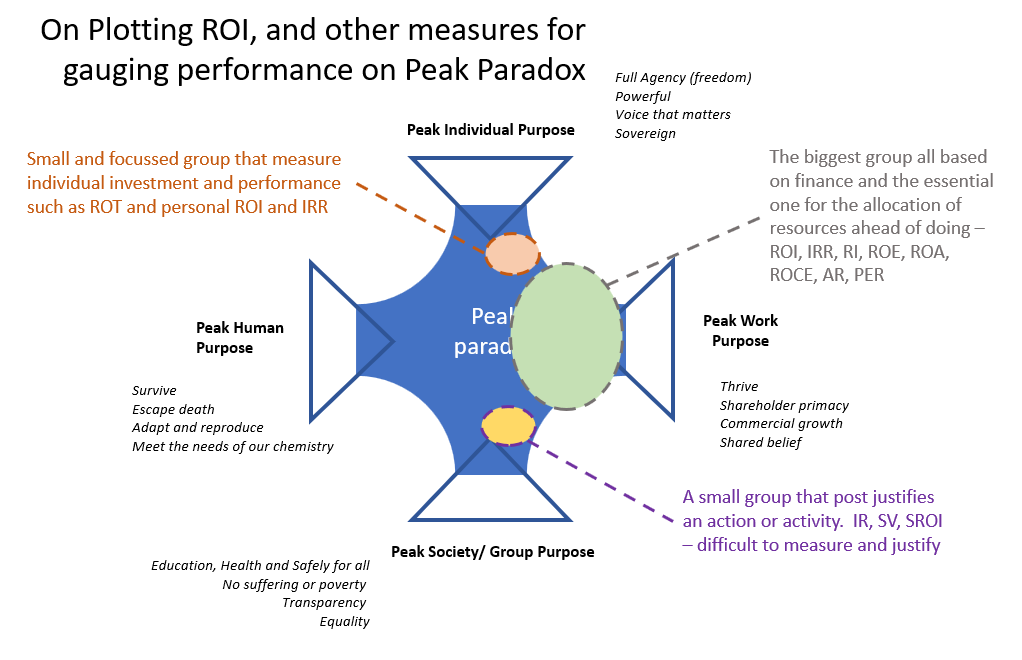
Plotting ROI, and other measures for gauging performance on Peak Paradox
The purpose of this post is to plot where some (there is way too many to do them all) different investment measures align on the Peak Paradox model. It is not to explain in detail what all the measures means and their corresponding strength and weaknesses. This is a good article if you want the latter for the pure financial ones.
Key
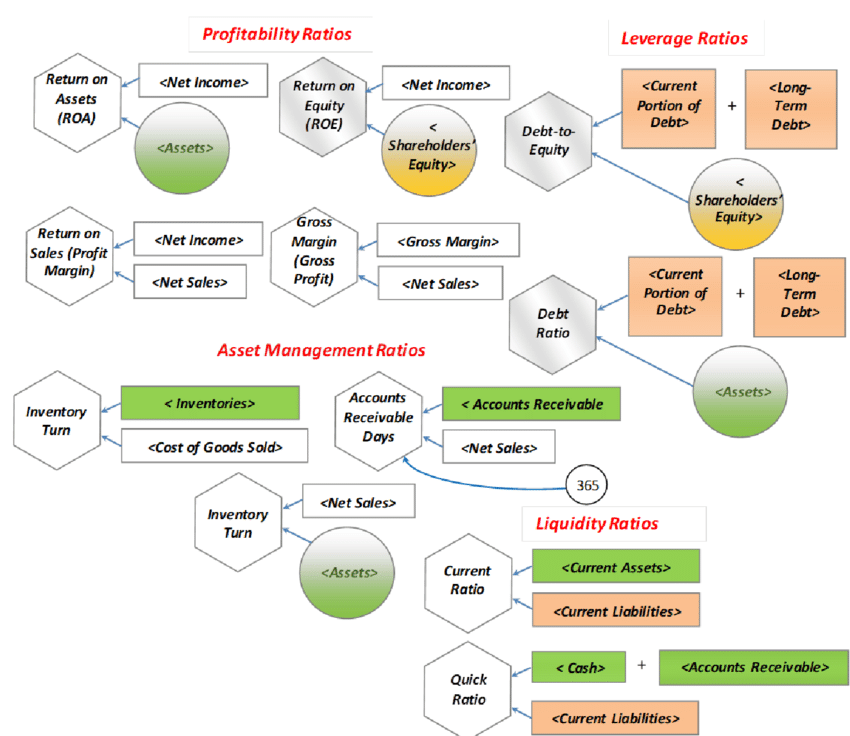
ROI, Return on Investment. IRR Internal Rate of Return. RI Residual income. ROE Return on Equity. ROA Return on assets. ROCE Return on Capital Employed. ROT Return on Time. IR Impact return. SV Social Value. AR Asset Returns. PER Portfolio Expected Return. SROI Social return on investment.
The observation is that we have not developed with any level of sophistication the same ability to measure or report on anything outside of finance, which we call “hard.” By calling other important aspects of a decision “soft” we have framed them as less important and harder to agree on.