Imaging Digital Strategy starting from TRUST
The purpose of this post is to set out the logic and background thinking to help create a digital strategy based on the concept of consumer TRUST. By the end you should have a framework to debate internal assumptions and hurdles which may be preventing your organisation from realising a transformation to digital thinking.
This post starts out by looking at the strategic options which have dominated management thinking for over 50 years and how they are challenged by platforms and Data; including Big Data. It considers what happens if companies maintain existing strategies and styles, since these dominant forces (strategy and style) have path dependency (as in the economic definition). There is a recognition that the pressure of short term reporting and financial planning, with linear models, leads to a lack of appetite to focus on exponential ideals due to perceived risk but how these current limitations may ultimately lead to decline.
Whilst an obvious solution would be to recreate an organisation, such an overly simplistic view ignores the complexity of the company, the people, its processes and other pressures. Therefore the final part of the paper considers the technology adoption curve and the adoption of many processes which can create agility where required. Amazon is highlighted as an example and how they are creating a new organisation fit for modern markets based on rethinking innovation and processes.
Where both you and your competitor have low competency (bottom left), therefore questioning if there is actually a market. This could be innovation on a path to utility or a market in decline, however the focus is not on this square, if it were the boston matrix - this is the dog or question mark.
(B1 and B2) Where either you or your competitor has high competency and the other is low, this is where the application of strategies apply to win/ dominate are utilised. Depending on where you are in the life cycle this is a cash cow hoping to be reborn or the question mark becoming the new star.
Where both you and your competitor have high competency, you follow classical and well understood strategic practices from flexing the P’s of marketing to buying up the market. The aim is to maintain the position and growth (star).
This framework has stood the test of time for well over 30 years, however with the emergence of platform thinking and data, these strategic options, the established frameworks and the game theories that have prevailed need to be updated.
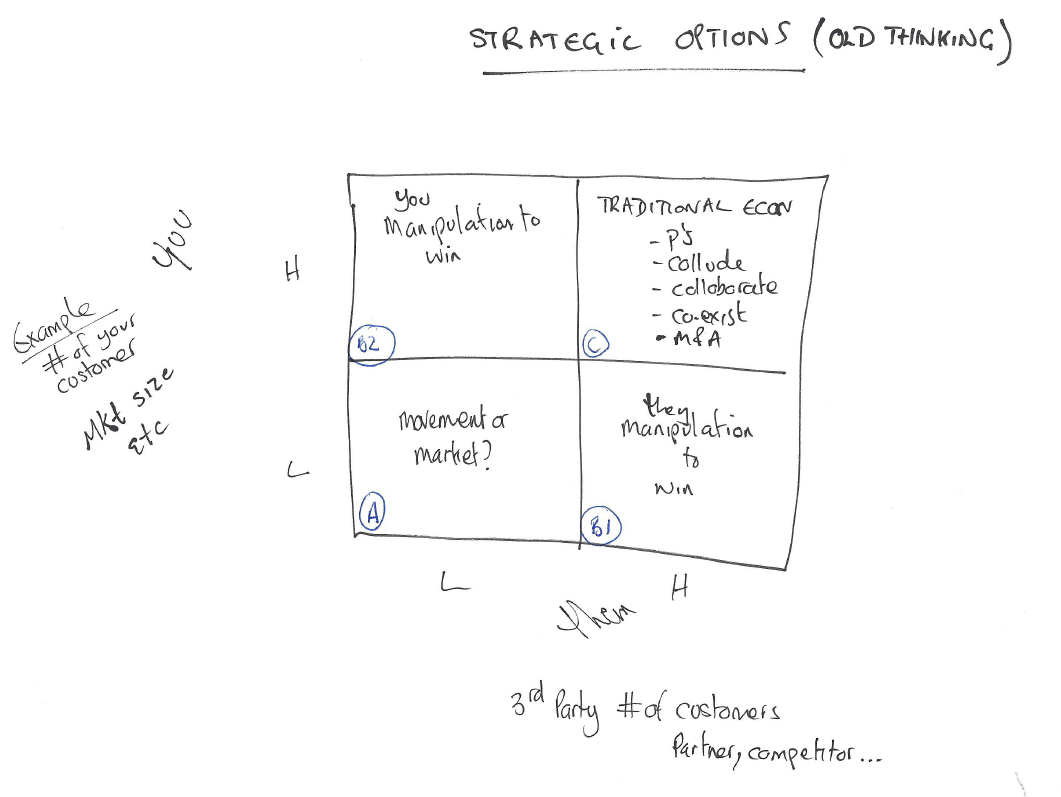
Chart 1 : strategic options (classical thinking)
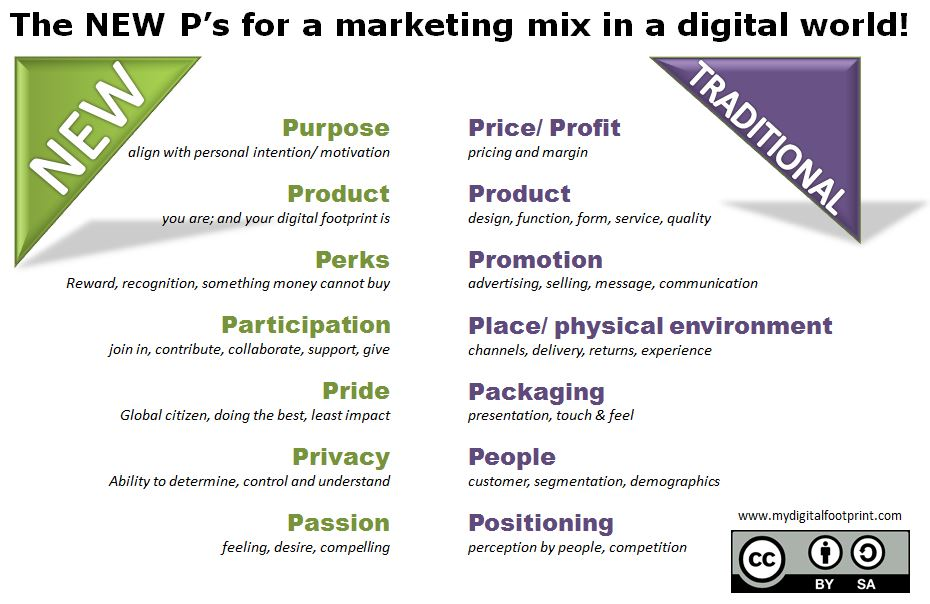
The classic economic market theory, where you and another player could use pricing, offers and other marketing tools to compete; has been eroded by data models. The 6P’s of marketing have morphed (updated, adopted, moved on) as shown below and is explored in depth here https://goo.gl/gVaHC3
A theory to enable companies to remain competitive in this emerging digital era and nacsent data market starts from an (there are others but exploring here trust) assumption or understanding that “consumers/ users need to be able to TRUST your enterprise/ startup/corporate with their data (the data a user gives you or you collect from sensors) and any data you create about them (analysis and insights)”.
This ideal positioning of being a “trusted brand with data” is the top right hand square in chart 2 below. It is an assumption of where the market wants to get to. Given this belief / assumption about the importance of trust, the behavioural shift in an organisation must be towards establishing trust with the user to hold and use their data and create shared value.
Why is trust so important as a new competitive tool? One reason is that in the old strategic framework, if you had dominance in a market you could defend it. Loyalty is an economic manipulation not a basis of trusted relationship. There was no real need for emotional “trust” (doing what is in the best interests of the consumer); just functional trust (make sure it worked). These topics of trust are explored here)
In the data competitive landscape Google, Facebook, Amazon can come into your market and offer the same service for free, with the idea of using data as the value exchange. This, we have already seen means classic cash cow markets and products decline to zero margin if you want to remain a competitor. The value moves. Whilst examples such as the FATG gang can disrupt a market with the offer for free, that is not enough as a long term strategy - trust has become critical.
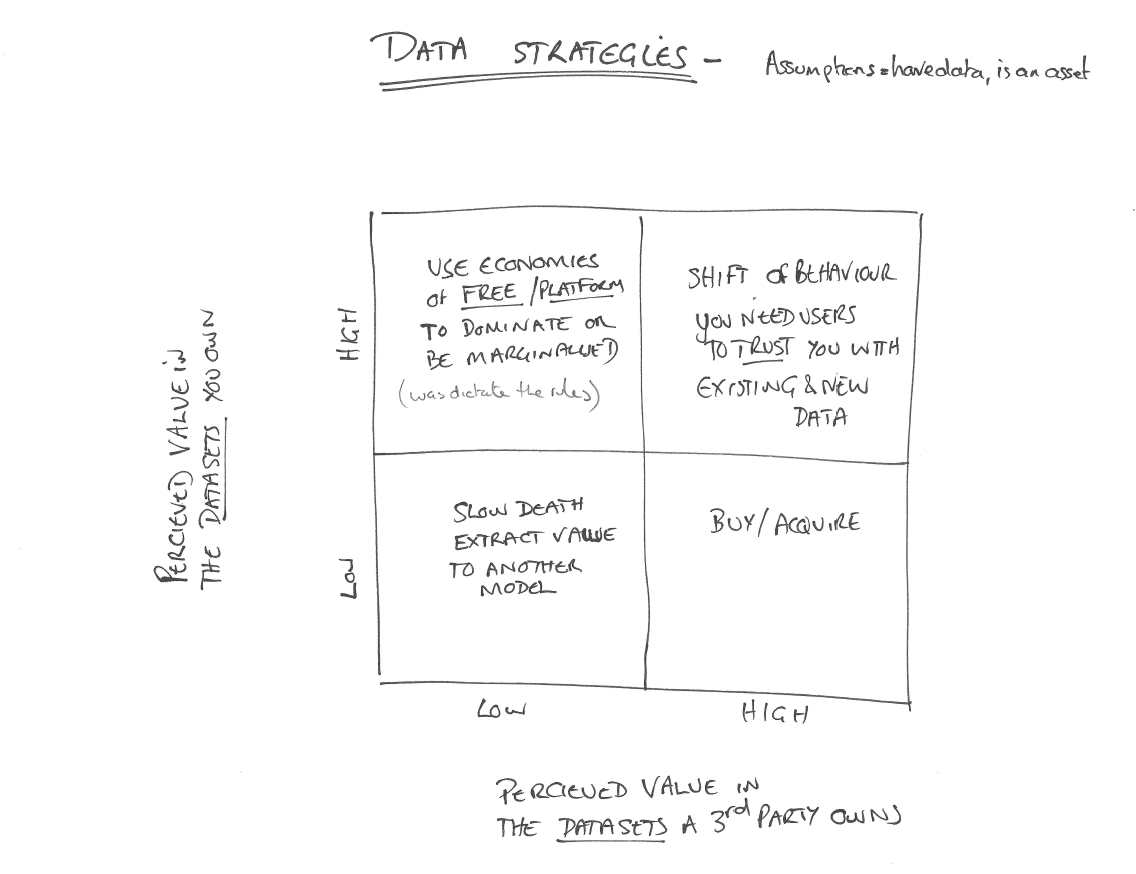 Chart 2: Data strategies
The same problem has been around for a long time; changing strategy and style is too risky, changing one is difficult, changing both does not lead to great outcomes. There may be success in changing both strategy and style but following someone’s else's success is NOT a guarantee of success, these “change strategies” don’t translate or copy well. Changing style has come to mean, based on my experience, playing about round the edges with accelerators, incubators, eco-systems, garages, EIR, labs and funds but these do not actually change anything. They feel mighty good and can be very rewarding (profile, PR, energy) but they are unlikely to change anything fundamental in the long term. Whilst there will always be the exception, it is also why we have an increasing number of models that people try following; the example of one which worked for someone else. Therefore we have to consider the one that is too risky transformation, change everything!
An obvious hurdle is that the executives and senior management love the edge cases for innovation (not changing the core) as they know from experience that real transformation is exceptionally hard and prefer to keep existing strategies and styles in place, but hope that it will all work out (short termism). It is evident now that no change is not an option, the two easiest options (keep strategy or style) lead to too many unknowns or not enough difference (but there are examples of un-repeatable successes) and therefore for the few - it is time for the brave to stand up having probably made progress on changing the style in some parts.
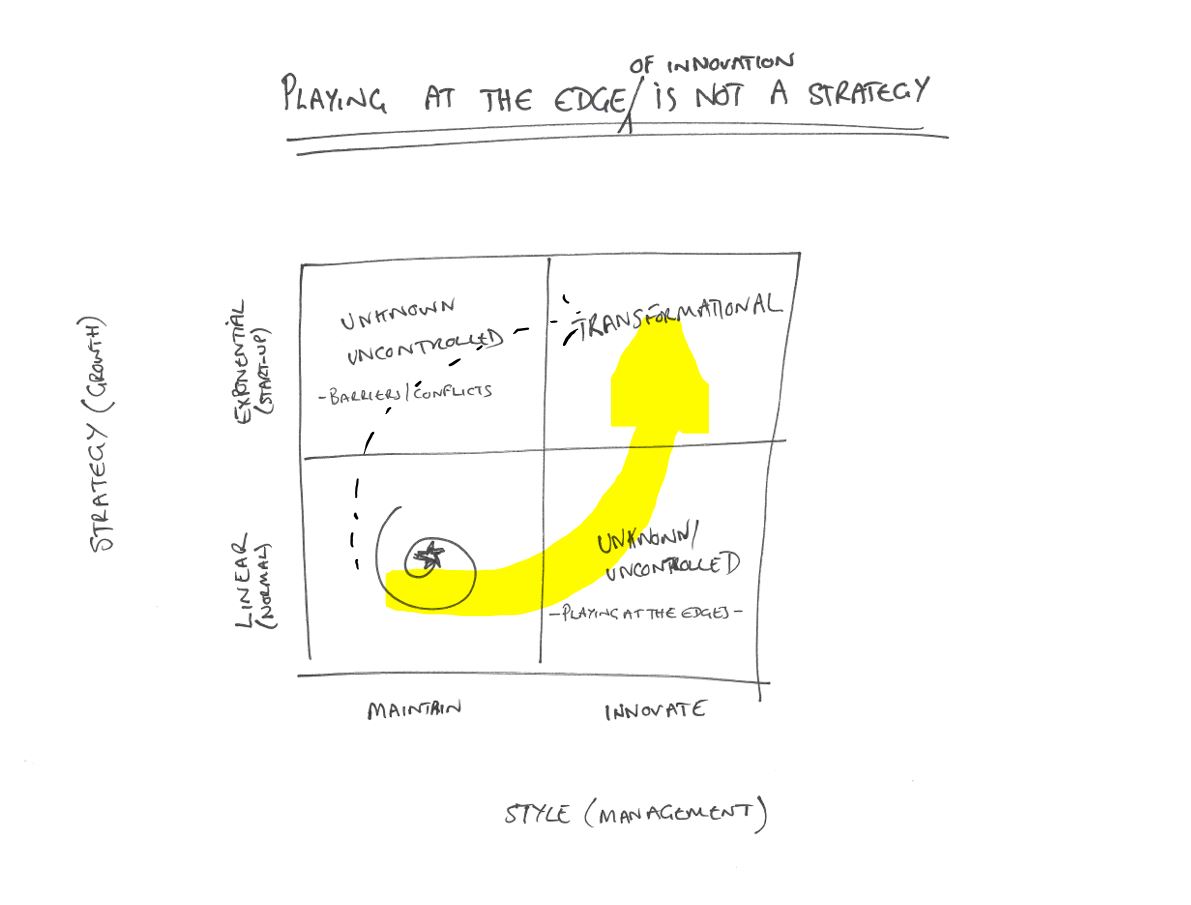
Chart 3 : Playing at the edge of innovation is not a strategy
Exponential looks so easy on paper and is as easily misunderstood. Chart 4. The new plan arrives on the decision makers desk in response to the demand, “Deliver me 1 million new customers in four years.” The approved budget will be for a linear growth in all probability. No one will sign off an initial 30 month period with no new customers, hoping that it will all happen in month 26. Proof points, path dependency, budgeting, KPI, rewards, reviews and risk profiling prevents any decision for growth but linear, hence in the previous chart 3, why linear growth is the most favoured case to follow and innovation as a response to change; but this incremental adjustment will not create the change that is wanted.
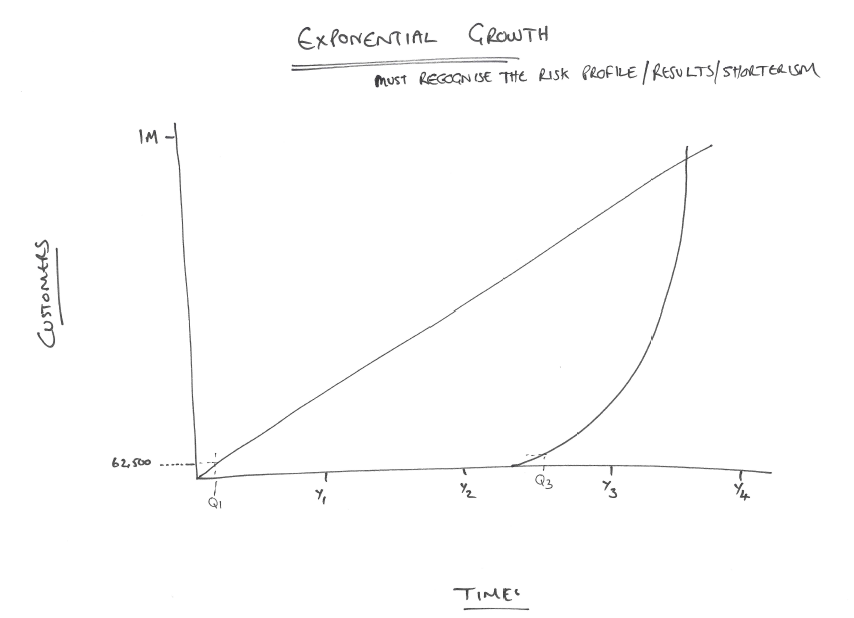
Chart 4 : what does exponential look like?
The desire at exec level for growth and change is real as every scaling start-up has shown it is possible, but the temptation to set a 7%, double in 10 years plan is attractive as per chart 5. Worth noting; if you can achieve a doubling in 10 years it will make you one of the most successful ceo/ teams in history. The reward is still massive even if you miss a bit. However solving one customer problem and doing it well can far out strip that nobel achievement as most companies in real terms only every hit 2 to 3%.
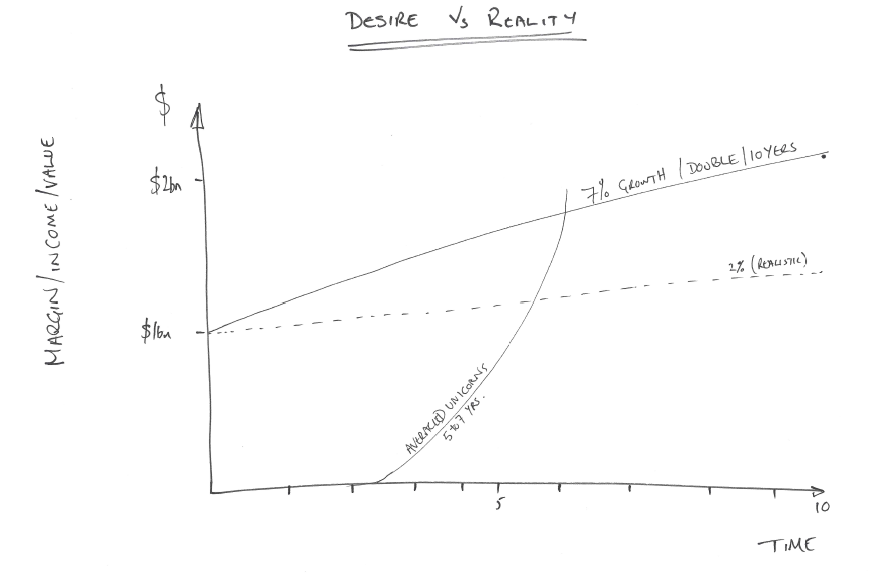
Chart 5: desire or reality
A possible scenario could be that the next casualty of Digital is not an industry but management itself but the pressures to keep the existing are so very strong, hence there is a need for a new model This is the case for (No) Organisation Chart 6 puts up an overly simplistic summary of this thinking.
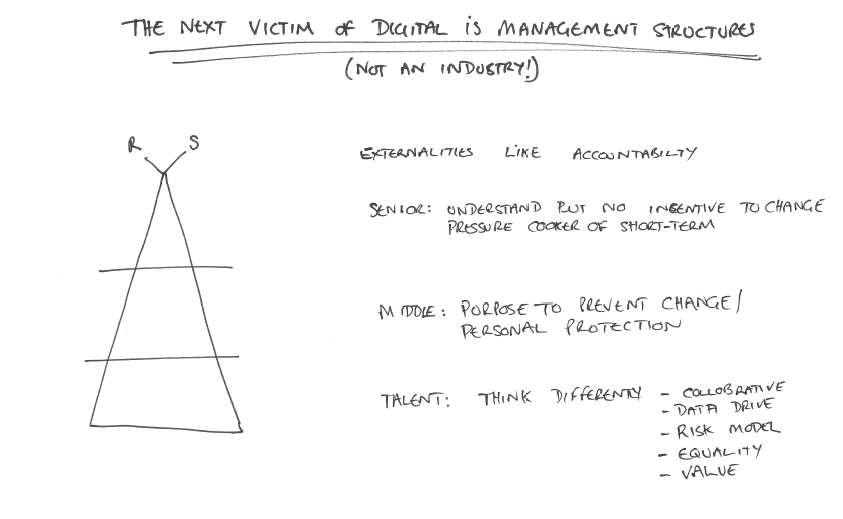
Chart 6 : organisation 2.0
To frame the problem of what a corporate can do let’s consider the adoption of activities, processes, data and control (as examples) as companies grow, as it will help explain the tensions and opportunities. This is an adoption from work with and by Simon Wardley based on the Cynefin model. Chart 7 and can easily be combined with Zones to Win from Geoffery Moore.
Exploring chart 7. On the Y axis is a measure of Ubiquity - going from novel/new to common/widespread. On the X axis is Certainty, Low to high. Across the chart is the classic S curve of adoption, from innovation (uncertain outcomes and novel) to commodity (certain outcome and common)
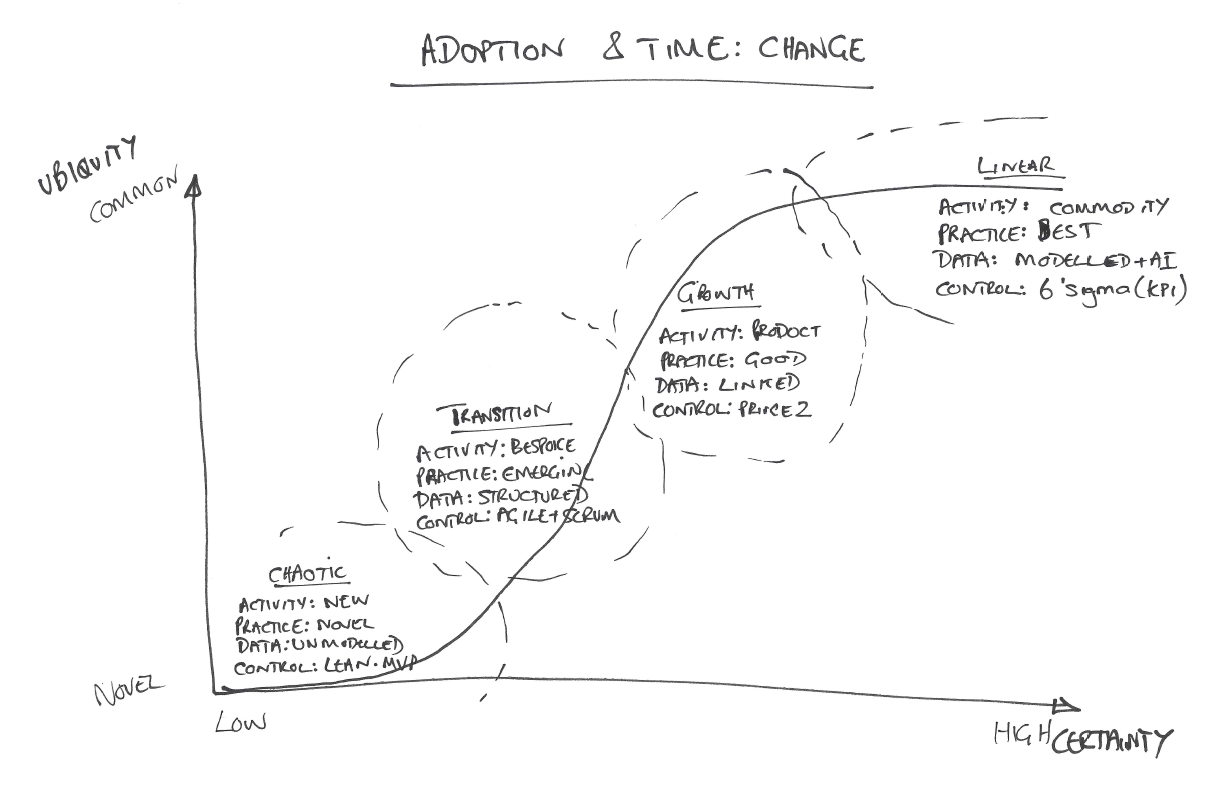
Chart 7 : adoption and time
In phase one: where an idea is novel and the outcome is uncertain, chaos reigns. All activities are new and unstructured. Any practices are novel, data is unmodelled and the company is focused on using ideals like MVP and lean to get a first iteration out of the door
In phase two: where an idea is transitional from novel to a bespoke item, the outcome is focused on one product or service and speed reigns. All the activities of the company tend to be bespoke. Any practices are emerging, data is structured and the company is focused on using ideals like agile and scrum to bring order, features and functions through quickly.
In phase three: where the offer is growing from bespoke to production, the outcome is focused on product or service varientient and improvement reign. All the activities of the company tend to be product focused. Any practices are good, data is linked and the company is focused on using ideals like prince 2 to control margin.
In phase four: where the offer is slight tweaks and improvements on the move to commodity and utility, the outcome is focused on marginal improvements and new ideas. All the activities of the company tend to be finance focused. Any practices are best, data is modelled and all controlling, utilising AI and the company is focused on using ideals like 6 sigma to control efficiency and effectiveness.
What is evident is that digital organisations who are thriving in an environment of near constant change (innovation to commodity at the same time) will be adaptive, hyper-aware and driven by purpose, data and dynamic processes. This new organisation will thrive on transparency, agility and open-governance. To state the obvious, this is different to politics, hierarchy and top down control.
Platform economics and thinking emerged in early 2000’s as a new strategic framework. A platform being a set of components used in common across a product family whose functionality can be extended by third parties (Boudreau 2007) and which is characterized by network effects (Eisenmann, Parker & Van Alstyne 2006, 2011). https://hbr.org/2016/04/pipelines-platforms-and-the-new-rules-of-strategy
However this thinking is evolving to now consider platform of platforms. Using the example of Amazon and plotting their progress by using the same axis of ubiquity and certainty as in the adoption curve above.
Amazon started from a website (novel and uncertain) and focussed on customer service to build and grow “Functional” trust, which meant they became the number 1 book site. However, rather than seeking the next innovation using their best brains and innovation experts, they enabled the community to create it. They collected and analyzed the data and saw patterns emerge that led to new book services. Rather than competing with the new businesses, then enabled them, helping them to scale as Amazon scaled. Again this repeated as Amazon collected more data to discover new services to offer from Prime to video to music to FRESH, each time enabling the community to thrive. With Fresh Amazon enabled the farmer market to reach a digital world by bringing processes, scale, trust and value and not competing with the suppliers. Yes the poor quality retailers and other middle no-value adding agents in the supply chain lose out. Chart 8 exploring this as a picture.
The point is that a corporate needs to consider how to create many platforms from its existing business and not one, how to create an ecosystem that it builds its business with and not about extracting value from the community, how to find and utilise data better: all whilst still increasing the efficiency and effectiveness of the core.
But without data this will not happen, and to be trusted (really putting the customer first) with consumer data is the next battle ground
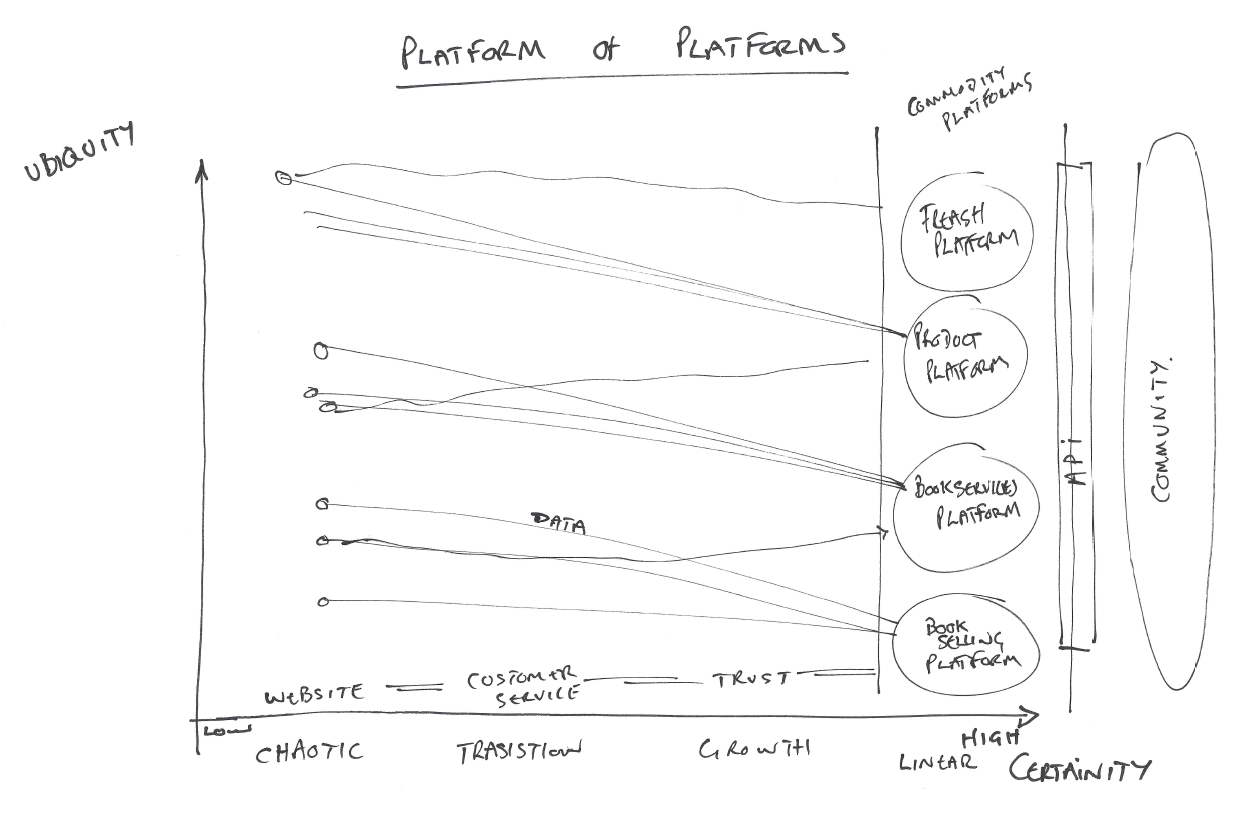
chart 8: platform of platforms
More reading
https://www.ft.com/content/4afb31b0-91eb-11e5-bd82-c1fb87bef7af
https://www.hbs.edu/faculty/Pages/item.aspx?num=496
https://hbr.org/2007/02/raising-haier
A post exploring the consumer TRUST and why they matter is linked here. If your not sure about the types of consumer trust that exist, please do read that one first.
This post starts out by looking at the strategic options which have dominated management thinking for over 50 years and how they are challenged by platforms and Data; including Big Data. It considers what happens if companies maintain existing strategies and styles, since these dominant forces (strategy and style) have path dependency (as in the economic definition). There is a recognition that the pressure of short term reporting and financial planning, with linear models, leads to a lack of appetite to focus on exponential ideals due to perceived risk but how these current limitations may ultimately lead to decline.
Whilst an obvious solution would be to recreate an organisation, such an overly simplistic view ignores the complexity of the company, the people, its processes and other pressures. Therefore the final part of the paper considers the technology adoption curve and the adoption of many processes which can create agility where required. Amazon is highlighted as an example and how they are creating a new organisation fit for modern markets based on rethinking innovation and processes.
Strategic Options: the classic competitive strategy
Consider a classic two by two box matrix, label one axis something that is critical to your success and plot on the other other axis how your competitor (real or perceived) performs on the same metric, this is imaged in chart 1 below.Where both you and your competitor have low competency (bottom left), therefore questioning if there is actually a market. This could be innovation on a path to utility or a market in decline, however the focus is not on this square, if it were the boston matrix - this is the dog or question mark.
(B1 and B2) Where either you or your competitor has high competency and the other is low, this is where the application of strategies apply to win/ dominate are utilised. Depending on where you are in the life cycle this is a cash cow hoping to be reborn or the question mark becoming the new star.
Where both you and your competitor have high competency, you follow classical and well understood strategic practices from flexing the P’s of marketing to buying up the market. The aim is to maintain the position and growth (star).
This framework has stood the test of time for well over 30 years, however with the emergence of platform thinking and data, these strategic options, the established frameworks and the game theories that have prevailed need to be updated.
Chart 1 : strategic options (classical thinking)
Digital Strategies: Data changes the rules
To compete in a digital world, where data is both an imperative, asset and liability, a new set of game theories need to be debated, recognised and agreed. Data in this context is data about customers. [There are wider issues with other company data sets: finance, sales, marketing, operational, HR , logistics and legal but they are not the focus here ]The classic economic market theory, where you and another player could use pricing, offers and other marketing tools to compete; has been eroded by data models. The 6P’s of marketing have morphed (updated, adopted, moved on) as shown below and is explored in depth here https://goo.gl/gVaHC3
A theory to enable companies to remain competitive in this emerging digital era and nacsent data market starts from an (there are others but exploring here trust) assumption or understanding that “consumers/ users need to be able to TRUST your enterprise/ startup/corporate with their data (the data a user gives you or you collect from sensors) and any data you create about them (analysis and insights)”.
This ideal positioning of being a “trusted brand with data” is the top right hand square in chart 2 below. It is an assumption of where the market wants to get to. Given this belief / assumption about the importance of trust, the behavioural shift in an organisation must be towards establishing trust with the user to hold and use their data and create shared value.
Why is trust so important as a new competitive tool? One reason is that in the old strategic framework, if you had dominance in a market you could defend it. Loyalty is an economic manipulation not a basis of trusted relationship. There was no real need for emotional “trust” (doing what is in the best interests of the consumer); just functional trust (make sure it worked). These topics of trust are explored here)
In the data competitive landscape Google, Facebook, Amazon can come into your market and offer the same service for free, with the idea of using data as the value exchange. This, we have already seen means classic cash cow markets and products decline to zero margin if you want to remain a competitor. The value moves. Whilst examples such as the FATG gang can disrupt a market with the offer for free, that is not enough as a long term strategy - trust has become critical.
Chart 2: Data strategies If there is a new landscape of competitive forces, what strategy and style needed?
Chart 3 provides a matrix framework for thinking about this. Many large investor groups are publicly saying that maintaining a linear growth and existing style will lead them reallocating funds away from those who just maintain the same strategy (linear growth) and style (no change) Blackrock has lead the charge on this. This is the bottom left quadrant in chart 3, labeled the death loop.The same problem has been around for a long time; changing strategy and style is too risky, changing one is difficult, changing both does not lead to great outcomes. There may be success in changing both strategy and style but following someone’s else's success is NOT a guarantee of success, these “change strategies” don’t translate or copy well. Changing style has come to mean, based on my experience, playing about round the edges with accelerators, incubators, eco-systems, garages, EIR, labs and funds but these do not actually change anything. They feel mighty good and can be very rewarding (profile, PR, energy) but they are unlikely to change anything fundamental in the long term. Whilst there will always be the exception, it is also why we have an increasing number of models that people try following; the example of one which worked for someone else. Therefore we have to consider the one that is too risky transformation, change everything!
An obvious hurdle is that the executives and senior management love the edge cases for innovation (not changing the core) as they know from experience that real transformation is exceptionally hard and prefer to keep existing strategies and styles in place, but hope that it will all work out (short termism). It is evident now that no change is not an option, the two easiest options (keep strategy or style) lead to too many unknowns or not enough difference (but there are examples of un-repeatable successes) and therefore for the few - it is time for the brave to stand up having probably made progress on changing the style in some parts.
Chart 3 : Playing at the edge of innovation is not a strategy
Exponential looks so easy on paper and is as easily misunderstood. Chart 4. The new plan arrives on the decision makers desk in response to the demand, “Deliver me 1 million new customers in four years.” The approved budget will be for a linear growth in all probability. No one will sign off an initial 30 month period with no new customers, hoping that it will all happen in month 26. Proof points, path dependency, budgeting, KPI, rewards, reviews and risk profiling prevents any decision for growth but linear, hence in the previous chart 3, why linear growth is the most favoured case to follow and innovation as a response to change; but this incremental adjustment will not create the change that is wanted.
Chart 4 : what does exponential look like?
The desire at exec level for growth and change is real as every scaling start-up has shown it is possible, but the temptation to set a 7%, double in 10 years plan is attractive as per chart 5. Worth noting; if you can achieve a doubling in 10 years it will make you one of the most successful ceo/ teams in history. The reward is still massive even if you miss a bit. However solving one customer problem and doing it well can far out strip that nobel achievement as most companies in real terms only every hit 2 to 3%.
Chart 5: desire or reality
A possible scenario could be that the next casualty of Digital is not an industry but management itself but the pressures to keep the existing are so very strong, hence there is a need for a new model This is the case for (No) Organisation Chart 6 puts up an overly simplistic summary of this thinking.
the next casualty of Digital is
NOT an industry but management
Chart 6 : organisation 2.0
However
Whilst the above call for a different approach and systematic change could work for a early stage business or scale-up, a wholesale change for a corporate is probably out of reach, even with the plethora of “burning platform memos” circulating. Therefore, what should a corporate do? The answer is probably framing what the problem actually is.To frame the problem of what a corporate can do let’s consider the adoption of activities, processes, data and control (as examples) as companies grow, as it will help explain the tensions and opportunities. This is an adoption from work with and by Simon Wardley based on the Cynefin model. Chart 7 and can easily be combined with Zones to Win from Geoffery Moore.
Exploring chart 7. On the Y axis is a measure of Ubiquity - going from novel/new to common/widespread. On the X axis is Certainty, Low to high. Across the chart is the classic S curve of adoption, from innovation (uncertain outcomes and novel) to commodity (certain outcome and common)
Chart 7 : adoption and time
In phase one: where an idea is novel and the outcome is uncertain, chaos reigns. All activities are new and unstructured. Any practices are novel, data is unmodelled and the company is focused on using ideals like MVP and lean to get a first iteration out of the door
In phase two: where an idea is transitional from novel to a bespoke item, the outcome is focused on one product or service and speed reigns. All the activities of the company tend to be bespoke. Any practices are emerging, data is structured and the company is focused on using ideals like agile and scrum to bring order, features and functions through quickly.
In phase three: where the offer is growing from bespoke to production, the outcome is focused on product or service varientient and improvement reign. All the activities of the company tend to be product focused. Any practices are good, data is linked and the company is focused on using ideals like prince 2 to control margin.
In phase four: where the offer is slight tweaks and improvements on the move to commodity and utility, the outcome is focused on marginal improvements and new ideas. All the activities of the company tend to be finance focused. Any practices are best, data is modelled and all controlling, utilising AI and the company is focused on using ideals like 6 sigma to control efficiency and effectiveness.
What is evident is that digital organisations who are thriving in an environment of near constant change (innovation to commodity at the same time) will be adaptive, hyper-aware and driven by purpose, data and dynamic processes. This new organisation will thrive on transparency, agility and open-governance. To state the obvious, this is different to politics, hierarchy and top down control.
Platform economics and thinking emerged in early 2000’s as a new strategic framework. A platform being a set of components used in common across a product family whose functionality can be extended by third parties (Boudreau 2007) and which is characterized by network effects (Eisenmann, Parker & Van Alstyne 2006, 2011). https://hbr.org/2016/04/pipelines-platforms-and-the-new-rules-of-strategy
However this thinking is evolving to now consider platform of platforms. Using the example of Amazon and plotting their progress by using the same axis of ubiquity and certainty as in the adoption curve above.
Amazon started from a website (novel and uncertain) and focussed on customer service to build and grow “Functional” trust, which meant they became the number 1 book site. However, rather than seeking the next innovation using their best brains and innovation experts, they enabled the community to create it. They collected and analyzed the data and saw patterns emerge that led to new book services. Rather than competing with the new businesses, then enabled them, helping them to scale as Amazon scaled. Again this repeated as Amazon collected more data to discover new services to offer from Prime to video to music to FRESH, each time enabling the community to thrive. With Fresh Amazon enabled the farmer market to reach a digital world by bringing processes, scale, trust and value and not competing with the suppliers. Yes the poor quality retailers and other middle no-value adding agents in the supply chain lose out. Chart 8 exploring this as a picture.
The point is that a corporate needs to consider how to create many platforms from its existing business and not one, how to create an ecosystem that it builds its business with and not about extracting value from the community, how to find and utilise data better: all whilst still increasing the efficiency and effectiveness of the core.
But without data this will not happen, and to be trusted (really putting the customer first) with consumer data is the next battle ground
chart 8: platform of platforms
More reading
https://www.ft.com/content/4afb31b0-91eb-11e5-bd82-c1fb87bef7af
https://www.hbs.edu/faculty/Pages/item.aspx?num=496
https://hbr.org/2007/02/raising-haier